![Creative Commons BY-NC-SA 3.0 Unported License [Creative Commons BY-NC-SA 3.0 Unported License]](http://www.obdurodon.org/images/cc/88x31.png) Last modified:
2021-12-27T22:03:50+0000
Last modified:
2021-12-27T22:03:50+0000
Author: Helena Bermúdez Sabel (helena.bermudez@usc.es)
Maintained by: David J. Birnbaum (djbpitt@gmail.com)
![Creative Commons BY-NC-SA 3.0 Unported License [Creative Commons BY-NC-SA 3.0 Unported License]](http://www.obdurodon.org/images/cc/88x31.png) Last modified:
2021-12-27T22:03:50+0000
Last modified:
2021-12-27T22:03:50+0000
Keyhole Markup Language (KML) is an XML-based standard for displaying geographic data in maps or earth browsers, such as Google Maps, Google Earth, Mapbox, Marble or HERE Maps. It has been an international standard of the Open Geospatial Consortium since 2008. KML was developed initially for use with Keyhole LT, a precursor of Google Earth that was acquired by Google in 2004.
KML documents must be in the KML namespace (http://www.opengis.net/kml/2.2
). The
root element of a KML file is <kml> and it typically contains at
least one <Document> element. The most used element in KML is
<Placemark>, a child of <Document>.
<Placemark> pinpoints a location through reference to the Earth’s
surface and it contains a <name> (the label of the pinpoint, to be
displayed on a map), a <description> (the tooltip that appears when
clicking on the icon), and a <Point>, which contains geographical
information inside a <coordinates> child element.
Thus, a basic KML document would look like this:
<?xml version="1.0" encoding="UTF-8"?>
<kml xmlns="http://www.opengis.net/kml/2.2">
    <Document>
        <name>Sample</name>
        <Placemark>
            <name>Obdurodonia</name>
            <description>Digital Humanists’ favorite place on Earth</description>
            <Point>
                <coordinates>-169.866667,-19.05,200</coordinates>
            </Point>
        </Placemark>
    </Document>
</kml>
KML uses a reference system of three-dimensional geographic coordinates: longitude,
latitude and altitude, in that order, with negative values for west, south and
below sea level. The longitude and latitude components are expressed in decimal degrees
(WGS84). The third value, altitude, is optional; if it is omitted from a
coordinate string, it assumes the default value of 0. Be aware that most websites with
mapping information (e.g., Flickr, Google, Multimap, Wikipedia, etc.) use the Geo microformat for
encoding and representing coordinate information. This means that, if not specified
otherwise, latitude is always the first value. For example, if you search for the
Cathedral of Learning in Google Maps, you will get the coordinates 40.444241,
-79.953370
, where the first value is latitude and the second longitude. However,
if you want to enter those into KML, where longitude precedes latitude, you must change
the order to
<coordinates>-79.953370,40.444241</coordinates>.
In addition to encoding individual pinpoints, you may want to create lines to connect
different locations in a map visually. To do so, still within a
<Placemark> element, instead of placing the
<coordinates> element inside a <Point>, put it
instead inside a <LineString> element. The
<coordinates> element inside a <LineString>
element must identify at least two points to connect; see the relevant section of the Google Developers KML reference for examples and
discussion. In addition to <Point> and
<LineString>, there are other objects that you can draw inside a
<Placemark>, such as <LinearRing>,
<Polygon> or <MultiGeometry>. See the Google
KML
Reference for more information.
Some of the geospatial software that understands KML supports the visualization of time data. However, in the wake of the December 2014 deprecation of the Google Earth API, we do not know about alternatives for building timelines with 3D mapping applications in the browser (other than Google Earth for Android). Because it is no longer possible to show live examples of timeline support within a browser, the timeline portion of this tutorial will be illustrated with screen shots from the Google Earth stand-alone application for personal computers.
To code a single moment in time, we use <TimeStamp>, the only child of
which is a <when> element, which contains the date.There is also a
<TimeSpan> element for expressing an extent in time; its child
elements are <begin> and <end>.
All dates in KML must be expressed using the ISO 8601 format YYYY-MM-DD, except that the day or both the month and day values may be omitted. To include time information the format is YYYY-MM-DDThh:mm:ssZ, where T is the separator between the date and the time information and Z indicates UTC:
<TimeStamp>
    <when>1997-07-16T07:30:15Z</when>
</TimeStamp>
Time within a specific time zone can be represented by using YYYY-MM-DDThh:mm:sszzzzzz, where we specify the local time and then the ± conversion to UTC. Expressing the seconds is mandatory in both of these formats.
<TimeStamp>
  <when>1997-07-16T10:30:15+03:00</when>
</TimeStamp>
Consider the following example, where we have coded the discovery of monotreme fossils,
which begins in the nineteenth century, using <TimeStamp> (lines 9–15
are explained below under the Styling section). Here is the
<PlaceMark> element for the most recent such discovery, Obdurodon
tharalkooschild, in 2012:
<Placemark>
    <name>Obdurodon tharalkooschild</name>
    <TimeStamp>
        <when>2012</when>
    </TimeStamp>
    <description>
        <!--et cetera-->
    </description>
    <Style>
        <IconStyle>
            <Icon>
                <href>http://dh.obdurodon.org/kml/images/Obdurodon.jpg</href>
            </Icon>
        </IconStyle>
    </Style>
    <Point>
        <coordinates>137, -19.5</coordinates>
    </Point>
</Placemark>
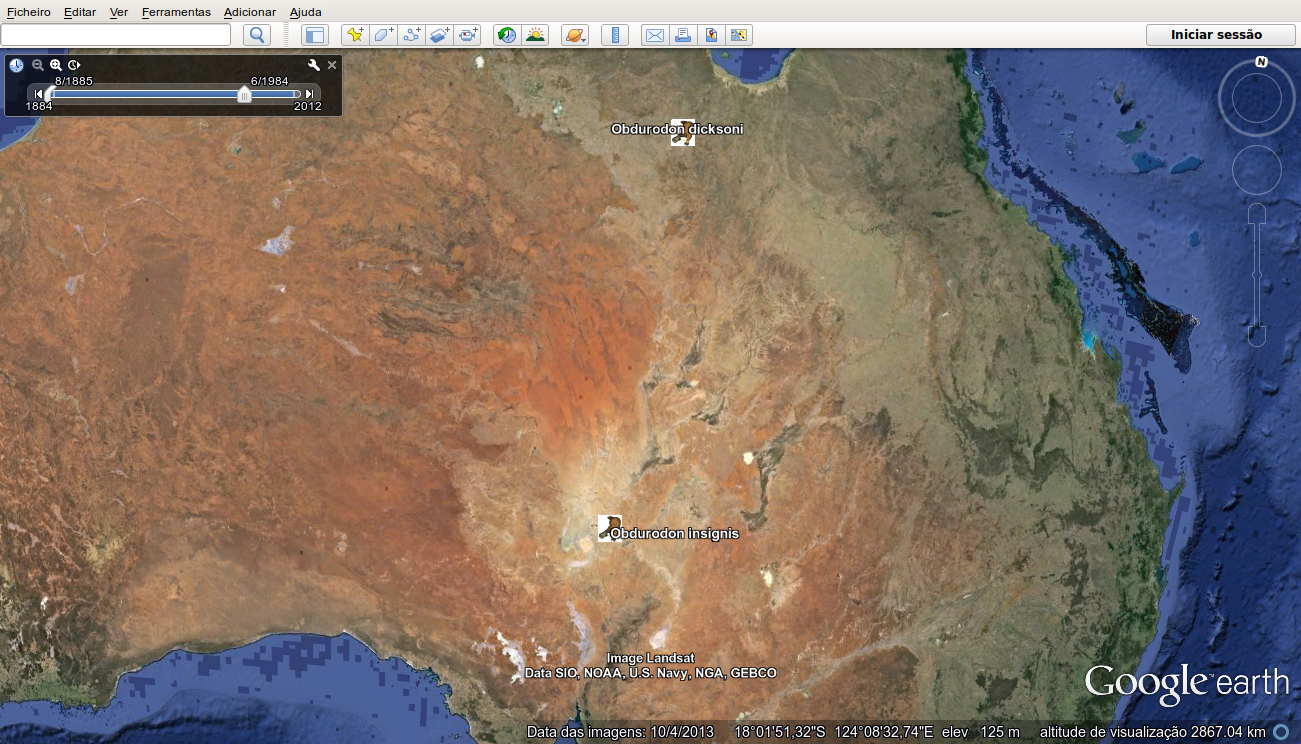
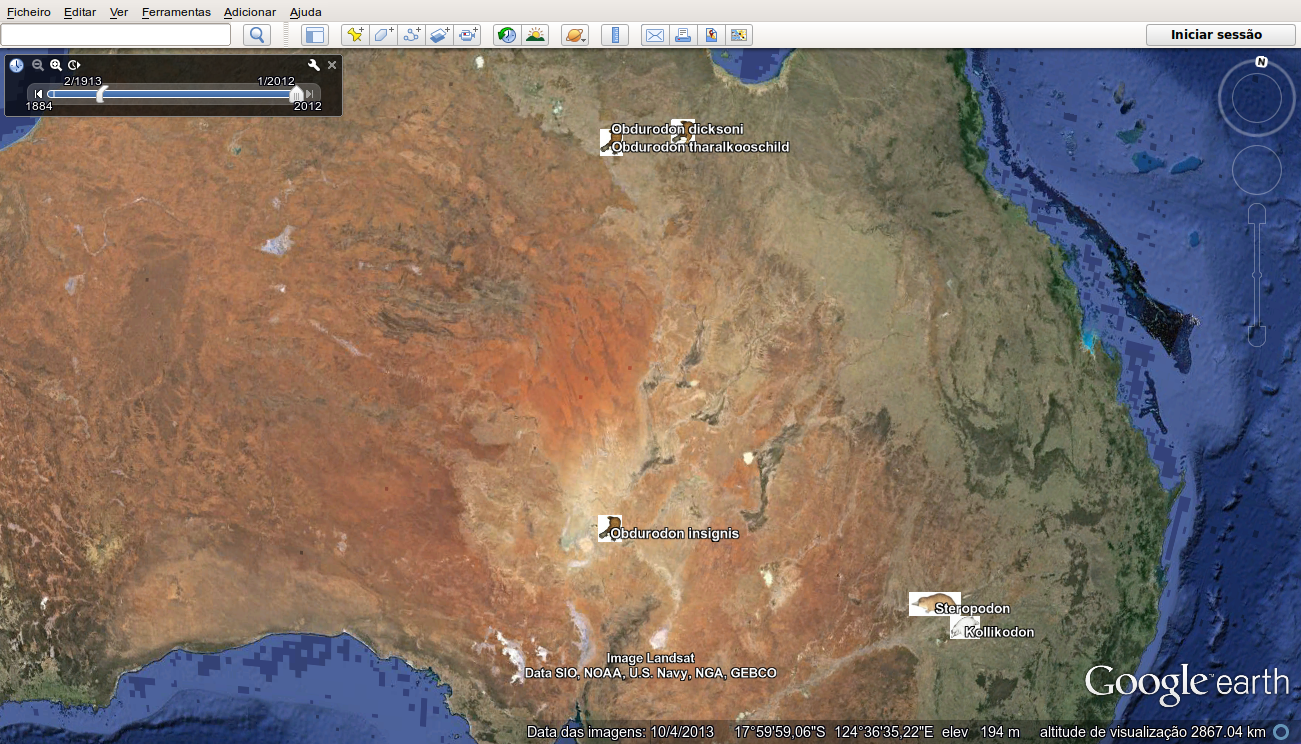
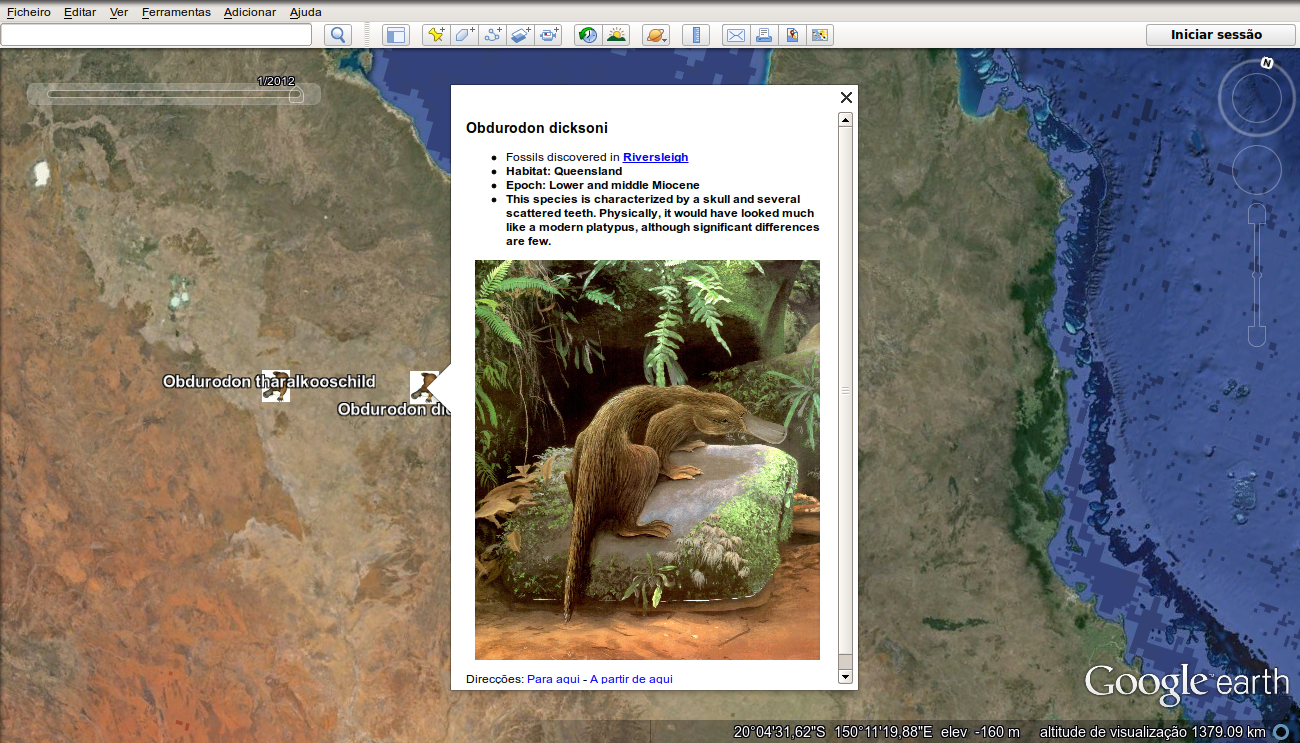
The following two screen shots capture different moments in the timeline progression, the
first in 1884 and the other in 2012 (showing icons for three additional species; a
fourth, the Zaglossus
hacketti, an extinct species of long-beaked echidna from Western Australia that
is dated to the Pleistocene, is not visible because the image has been cropped). The
third image is the result of clicking the icon for Obdurodon tharalkooschild, which
opens a view of the information associated with the <Point>.


You can review the complete code for this example to
learn more about the finer points of KML timeline syntax. For another example that uses
<TimeSpan> instead, see the Mapping medieval
Galician-Portuguese literature and its networks project globe (functional only
in browsers that continue to support the deprecated Google Earth browser plug-in) and its code.
Enhanced styling of map layers is usually accomplished by using a markup language called
Styled Layer Descriptor,
or SLD for short. SLD is an XML-based markup language that is both powerful and complex,
but in this section we will limit our discussion to the KML elements available for
customization. Most usefully, KML includes an element <Style>, which
can contain <IconStyle> to customize the pinpoints and
<LineStyle> to style the strokes that join two or more
geographical points.
One of the easiest ways to introduce different icons into your map is by copying the reference URLs used by Google. If you have installed the Google Earth application, you can use that to access to a list with all the available icons and their URLs. More interestingly, you can include your own icons by incorporating them directly into the KML, as in the following example, but with your own URL:
<Style>
    <IconStyle>
        <Icon>
            <href>http://dh.obdurodon.org/kml/images/megalibgwilia.jpg</href>
        </Icon>
    </IconStyle>
</Style>
The most common children of <LineStyle> are <color>
and <width>. Instead of the six-digit hexadecimal values that are
common in CSS, KML works with a eight-digit hex system; you can look up the values at the Zonum Solutions on-line KML color
utility. The <Style> element may contain an @id
attribute, and if you declare the different styles you will use at the beginning of your
KML file (after Document/name), you could refer to them afterwards using
<styleUrl>. The syntax is very simple:
<Document>
  <name>Sample</name>
  <Style id="purpleLine">
    <LineStyle>
      <color>50FF78B4</color>
      <width>3</width>
    </LineStyle>
  </Style>
  <Placemark>
    <description>An echidna’s journey</description>
    <styleUrl>#purpleLine</styleUrl>
    <LineString>
      <coordinates>
        <!--et cetera-->
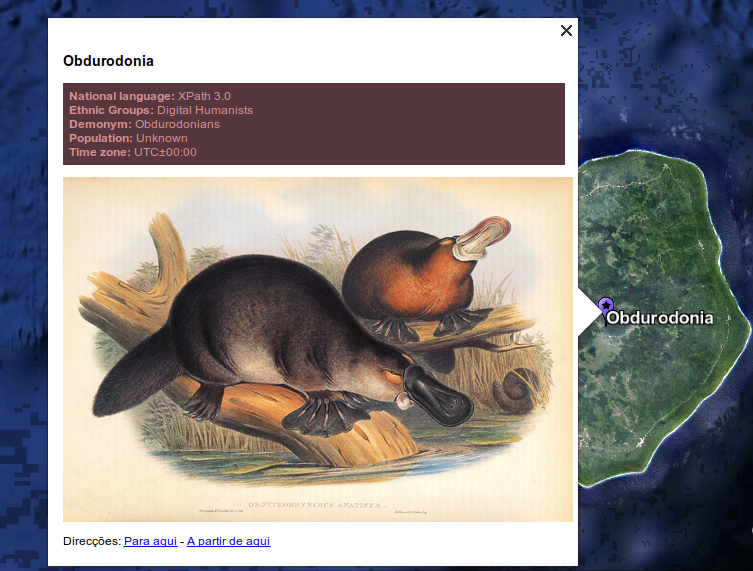
Because KML is XML, you can’t include HTML markup, with angle brackets, inside a
<description> element directly. You could use character entities
(< and >) instead of raw angle brackets to
wrap up the HTML elements. However, we recommend instead wrapping HTML inside a
CDATA marked section, as in the following example (pay special attention
to lines 4 and 15, since the marked sections require special delimiters):
<Placemark>
   <name>Obdurodonia</name>
   <description>
   <![CDATA[
    <p style="color:#DB9390;background-color:#57373E;
          padding:0.5em">
      <strong>National language:</strong> XPath 3.0<br/>
      <strong>Ethnic Groups:</strong> Digital Humanists<br/>
      <strong>Demonym:</strong> Obdurodonians<br/>
      <strong>Population:</strong> Unknown<br/>
      <strong>Time zone:</strong> UTC±00:00<br/>
    </p>
    <img src="http://www.obdurodon.org/images/platypus-01.png"
            alt="obdurodon"/>
    ]]>
   </description>
   <Style>
     <IconStyle>
          <Icon>
              <href>http://maps.google.com/mapfiles/kml/paddle/
                  purple-stars.png</href>
          </Icon>
      </IconStyle>
    </Style>
    <Point>
       <coordinates>-169.866667,-19.05,2000</coordinates>
    </Point>
</Placemark>

The CDATA marked section protects the HTML markup from being interpreted by the KML processor prematurely, so that it is included in the content and can be interpreted and rendered as HTML when needed.
Since the output KML has to be in the KML namespace, you need to be able to declare that
namespace. If you happen not to have memorized it, in <oXygen/> you can go to File
> New > Framework templates, select KML
, and copy the namespace declaration,
which you can then paste into the XSLT stylesheet you will create as the default output
namespace.
<xsl:stylesheet xmlns:xsl="http://www.w3.org/1999/XSL/Transform"
    xmlns:xs="http://www.w3.org/2001/XMLSchema" xmlns="http://www.opengis.net/kml/2.2"
    exclude-result-prefixes="xs" version="2.0">

<xsl:output method="xml" indent="yes"/>
In your template rule for the document node you need to create the root
<kml> element and its <Document> child. Add a
<name> child to the <Document> element, along
with any <Style> elements that you would like to refer later on.
For a detailed example of extracting geographical information from multiple XML files, see Elisa Beshero-Bondar’s Using XQuery and XSLT together to produce KML for mapping.
After saving your recently created KML file, use the Galdos Systems KML validator for validation, since <oXygen/> may report spurious errors.
In the likely case that the coordinates of your input XML file aren’t
formatted with longitude before latitude, as required by KML, we find it easiest to do
an identity transformation to
modify them before we generate the actual KML. You are likely to need the functions
concat(), string-join(), substring-after()
and substring-before(), which you can review in the XPath functions we use most
tutorial. You might also want to use <xsl:analyze-string>, which
you can read about in our
tutorial.
In this section, you will learn how to embed Google Maps displaying your data into HTML. We use Google Maps as an example, but other geospatial software that can render KML encoding, such as Maps Here, may be better suited to your requirements.
To create content in Google Maps to be embedded in your HTML you need to have a Google
Account. Log in, go to My maps
, and then click on the Create
icon. After selecting Create a new map
, click on Add layer
and then import
your KML file. If you want to be able to toggle among multiple layers, as in the Iberian poetry
example, you will need a different KML file for each layer. Once the data have
been uploaded, you can edit the place marks, modify their designs, add images, and
export the recently changed data as a new KML file (open the menu next to the Share
icon in
the interface for access).
Before publishing your map, verify the names of the layers and add descriptions of each
of them in the box to your left. Set a default view by zooming the map until your
current view of it is the one you want as a default; then under the folder icon select
Set default view
. Do the same each layer.
In order to create a link to your map, click the Share
button on the upper right
corner. You will be prompted to name the map and save it, and a new window will open
where you must change the permissions of the map. Under Under Who has access
,
change the default from Private
to Public
. Then copy the Link to
share
. Alternatively, after changing the access permissions, you can select the
Embed on my site
option available under the folder icon: you will get the
same link as before, but inside a @src attribute in an
<iframe> tag with @width and @height
properties, and you can copy and paste the entire <iframe> element
into your HTML.
A completely different method of embedding Google GIS visualizations into your site is by using the KML embed gadget.